
How to Look Up Philadelphia County Jail Population Data
The strongest official source is the First Judicial District Department of Research and Development Philadelphia Prison Population Report. It is published monthly and posted by the city. The report pulls the prison census file from the last day of each month and adds court data from Municipal Court, the Court of Common Pleas, and Adult Probation and Parole. That blend lets it classify people by the reason they are in custody, which a simple headcount cannot do.
The report is a data document, not a name-search tool. It shows totals, averages, and breakdowns rather than individual records. To read it, focus on the Average Daily Population figures and the confinement-category tables, which carry the most meaning. For a single person, the inmate locator is the right tool instead, covered later on this page. The value of the report is that it answers the bigger questions a roster cannot: how many people are held, why they are held, and how the count has changed. Reporters, researchers, and residents use it to understand the jail system as a whole, which is a different need than finding one person in custody.
Philadelphia County Jail Capacity Overview
The Department of Prisons runs four facilities on State Road, but the official facility pages reviewed do not publish capacity figures. So this page does not state exact capacities, since the numbers were not in the official sources. What the facility pages do describe is each building's role, which helps explain where people are held and why.
| Facility | Official Capacity Published? | Notes |
|---|---|---|
| Curran-Fromhold (CFCF) | No | Largest facility |
| Detention Center (DC) | No | Medical unit with a 99-bed health services wing |
| Industrial Correctional Center (PICC) | No | 13 unit-management housing units |
| Riverside (RCF) | No | Three-story facility with intake and treatment areas |
The 99-bed Prison Health Services Wing at the Detention Center is the one specific bed count the official pages give. Without published capacity figures, this page avoids any claim about how full each facility is, since that would require numbers the official sources do not provide. What the role descriptions do tell you is useful on its own. A person held at the Detention Center may be there for medical or behavioral health reasons, while the Industrial Correctional Center uses a unit-management design and Riverside handles intake and discharge. The locator's facility result, read against these roles, hints at a person's status even though the population report itself deals in totals rather than individuals.
Average Daily Population Explained
Average Daily Population, or ADP, is the industry standard for tracking a jail count, and the Department of Prisons uses it for operations. ADP smooths out the daily ups and downs that come from new admissions and releases, so it gives a steadier picture than a single-day snapshot. The report cautions that snapshot data is a best attempt at capturing a moving population and can contain errors, but the trends should be considered accurate.
One gap is worth noting for honesty. Some data was unavailable from October 2024 to February 2025 because the Department of Prisons moved to a new jail management system. That kind of caveat is exactly why the report frames its numbers as careful estimates rather than perfect counts. ADP is also the figure that lets you compare months fairly. A single bad day, such as a large weekend booking, can spike a one-day count, while the average absorbs it. So when the report says the population fell over a period, it is usually pointing to a change in the average, not a lucky low reading on one date. That is the right way to read any of the numbers on this page.
Demographic Breakdown
The report breaks the population down by race and ethnicity. The figures below come from the April 2026 report and describe the composition of the jail population at that time. These are county-specific numbers from the official report.
| Group | Share (April 2026) |
|---|---|
| Black | 72.6% |
| Latinx | 16.4% |
| White | 10.0% |
| Asian | 0.6% |
| Other | 0.5% |
The report also tracks sex, length of stay, arrest history, open cases, and cash bail amounts, which together explain who is held and why. A demographic breakdown like this is more useful than a raw total, because it shows how the jail population compares with the wider city and where disparities appear. The figures shift month to month, so the share for any group is a snapshot rather than a fixed number. Read alongside the confinement categories below, the demographic data helps explain which parts of the system, such as pretrial detention or probation detainers, drive who ends up in custody.
Serious Mental Illness Data
The report tracks serious mental illness, or SMI, status as part of the population profile. In the April 2026 report, 12.0% of the population was flagged with SMI status, compared with 7.2% in July 2024. That rise matters for operations, because the Detention Center serves as the medical and behavioral health unit and the system reports investment in behavioral health care. SMI tracking also connects to the diversion and treatment programs that the District Attorney and the courts run, which aim to route eligible people toward care rather than custody.
Pretrial, Detainer, and Sentenced Categories
One of the most useful parts of the report is how it sorts people by the reason they are held. Pretrial status is not the whole story, because detainers and open cases keep many people in custody. The report uses twelve confinement categories, and the largest April 2026 shares are below.
| Category | Share (April 2026) |
|---|---|
| Pretrial, non-murder, no detainers | 23.5% |
| Philadelphia probation detainers plus open cases | 20.8% |
| Other holds or detainers plus open cases | 20.8% |
The full list also covers pretrial murder cases, sentenced people with and without open cases, sentence-deferred categories, and federal or courtesy holds for agencies like the U.S. Marshals and FBI. The detail here is the report's biggest strength. A simple count of "people in jail" hides the fact that many are held not on a new conviction but on a detainer, an open case, or a pretrial status. The twelve categories let officials and the public see those distinctions, which matters for any policy aimed at safely lowering the count. It also explains why two people in the same facility can be there for very different legal reasons.
What Drives the Population
The category data shows that custody is rarely about one new charge alone. Probation detainers, other holds, and open cases overlap, so a single person can be held for several reasons at once. That is why bail reform and faster case review move the count more than any single policy. It also explains why the inmate locator and the population report tell different stories: the locator finds a person, while the report explains the system.
Note: Because detainers and open cases drive so much of the count, a drop in new arrests does not always lower the population at the same pace.
Population Trends Over Time
The long-run trend is a steep decline. The report states the population fell more than 50% from 8,082 people in July 2015 to 3,436 in July 2025. From July 2024 to April 2026, it dropped 32.3%, from 4,811 to 3,259. The anchor points below come straight from the official report and news posts.
| Date | Population |
|---|---|
| July 2015 | 8,082 |
| July 2024 | 4,811 |
| May 15, 2025 | 3,480 (lowest since April 17, 1992) |
| July 2025 | 3,436 |
| April 2026 | 3,259 |
The May 2025 news post on the all-time-low population is shown below.
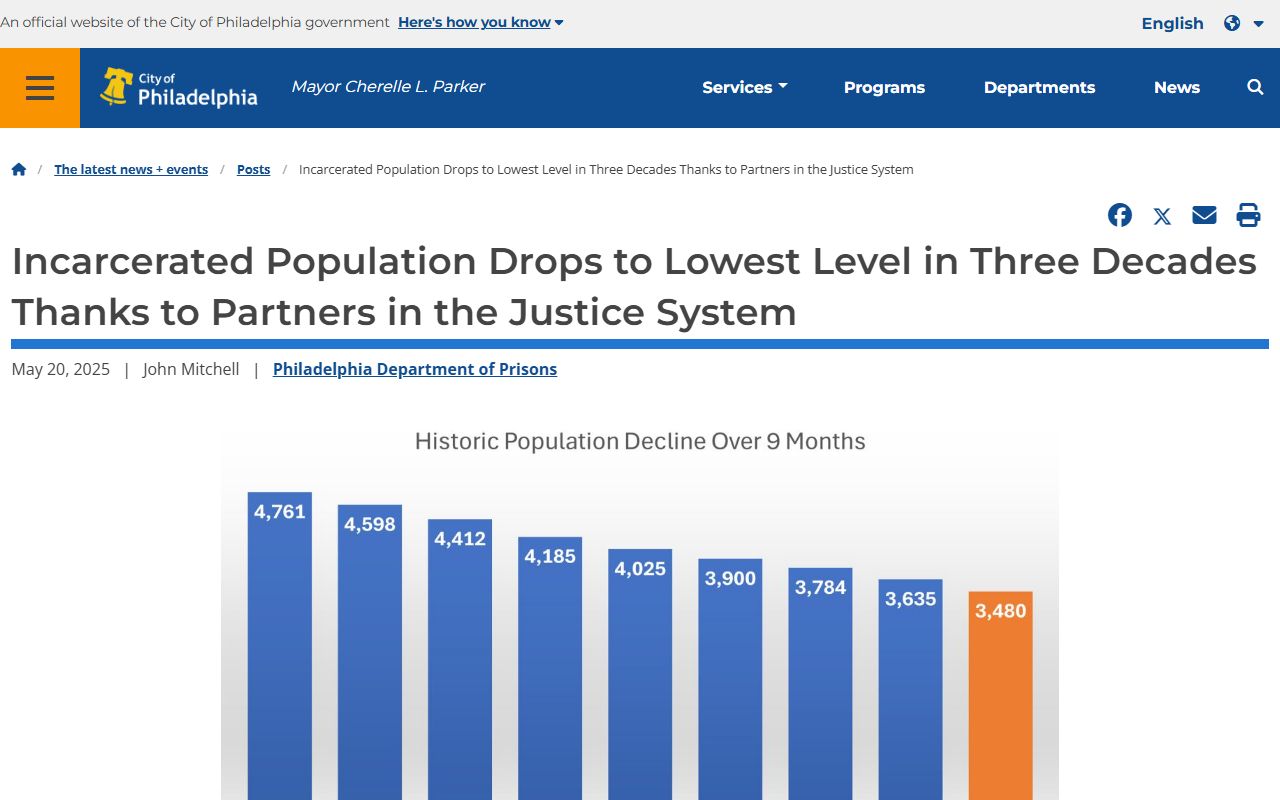
The post credited collaboration among the Department of Prisons, the courts, the District Attorney, and the Defender Association.
Reform Initiatives and Context
Philadelphia took part in the MacArthur Foundation Safety and Justice Challenge from 2015 to 2025. The May 2025 announcement tied the population drop to emergency bail hearings, expedited reviews of probation-related custody, and work on cases involving mental health and substance-use treatment. The challenge ended in 2025, but the city kept publishing monthly reports for transparency. The 2025 annual report announcement is shown below.
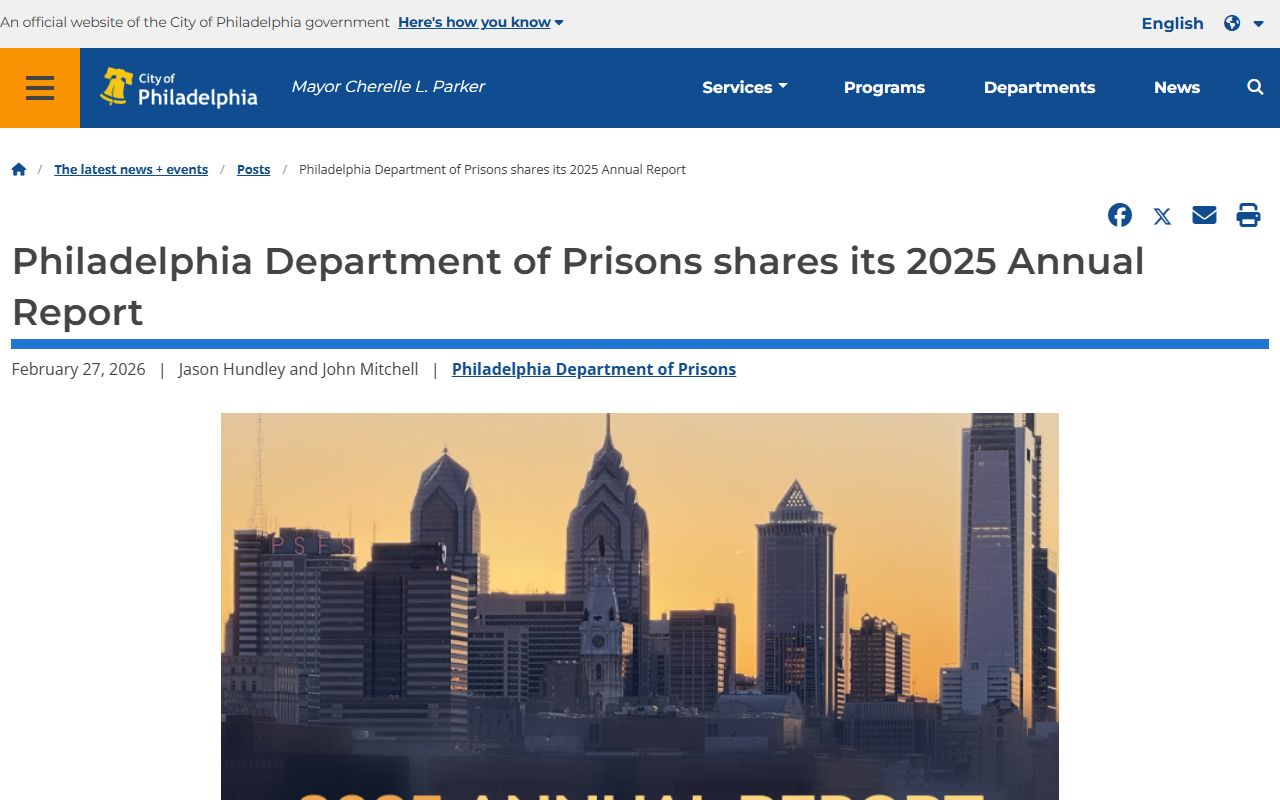
The annual report highlights staff growth, security investments, behavioral health care, substance-use treatment, and reentry services. Taken together, the reform record and the monthly reports give Philadelphia an unusually clear public view of its jail system. The May 2025 milestone, when the count reached its lowest level since April 1992, was credited to specific steps rather than a vague trend: emergency bail hearings, faster reviews of probation-related custody, and attention to cases tied to mental health and substance use. That kind of sourced explanation is stronger than a claim that the count simply fell on its own.
Where the Data Comes From
The numbers on this page come from the First Judicial District prison population report and official Department of Prisons news posts. The report merges the monthly prison census with court data from Municipal Court, Common Pleas, and Adult Probation and Parole. Because it pulls from several systems, it can classify people by legal status, detainers, mental health, and demographics. The report itself warns that snapshot figures are careful estimates, so treat exact monthly counts as close, not perfect.
Searching for Inmate Records by Name
This page is population data, not a name search. To find a specific person in custody, use the city inmate locator, which is covered on the Philadelphia County inmate records page. For release verification and notifications, see released inmates. The population report and the locator answer different questions, and using the right one saves time. The report explains the system as a whole, while the locator finds one person. For warrants and detainers that often keep people in custody, see warrant records.